Renewexa Power's assessment methodology delivers actionable insights that drive performance improvement. These case studies document actual renewable energy system evaluations conducted across Canada, demonstrating the value of professional diagnostics in optimizing clean power infrastructure.

Solar System Diagnostics

Alberta Solar Farm Performance Recovery

Location: Southern Alberta System Type: 8.5 MW Ground-Mounted Solar Assessment Period: Spring 2023
Alberta solar farm assessment

Challenge

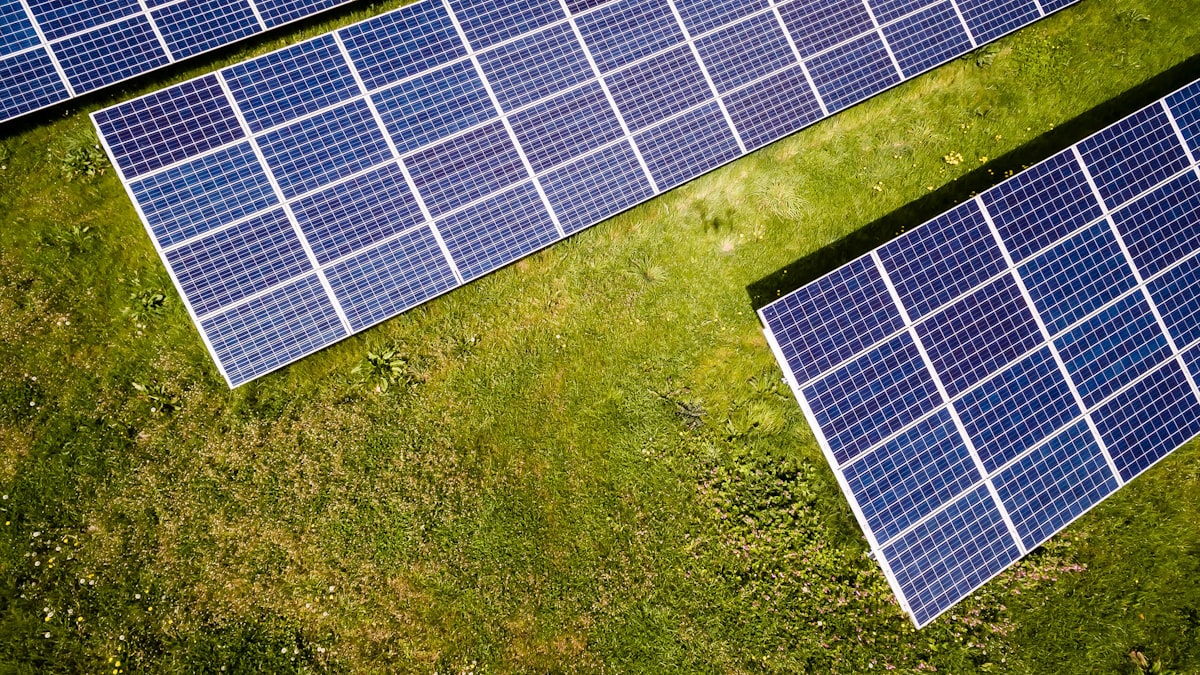
A utility-scale solar installation experienced declining performance ratios over its second operational year, falling from 82% to 74% PR. The operator requested comprehensive diagnostic assessment to identify causes and recommend corrective actions.

Assessment Approach

  • String-level I-V curve analysis across all 340 combiner boxes
  • Thermal imaging survey to detect hot cells and connection issues
  • Inverter efficiency testing under varying load conditions
  • Soiling analysis and environmental exposure mapping
  • Historical weather correlation with generation data

Key Findings

  • 23% of strings showing elevated series resistance indicating connector degradation
  • Soiling accumulation 40% above design assumptions due to local agricultural dust
  • Three inverters operating with reduced capacity from cooling fan failures
  • Shading from vegetation growth affecting 12 rows during low sun angle periods

Environmental Behaviour Analysis

Seasonal dust deposition patterns were significantly higher than anticipated during design phase. Summer agricultural activity (tilling, harvesting) created airborne particulates that accumulated on module surfaces. Winter snow shedding performance was adequate, but spring dust adhesion to residual moisture reduced irradiance transmission.

Performance Insights

-8%
PR Decline Identified
340
Strings Analyzed
78
Strings Requiring Attention
+6.2%
Projected PR Recovery

Recommendations Implemented

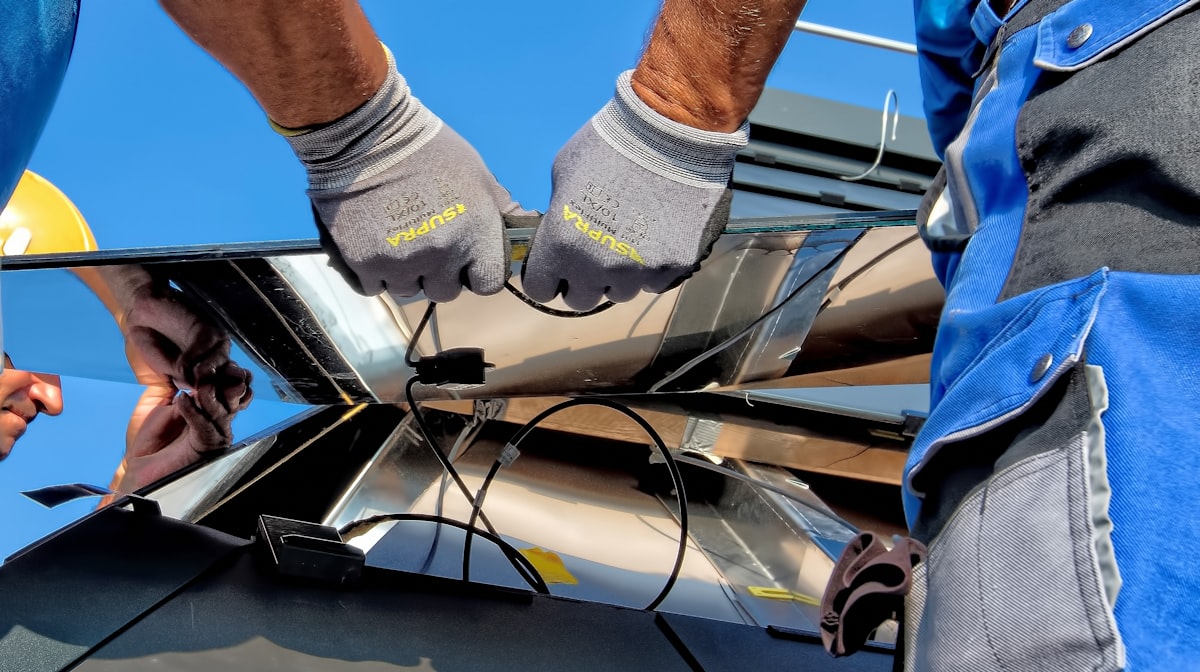
  • Connector replacement program for affected strings
  • Enhanced cleaning protocol (quarterly vs. semi-annual)
  • Inverter maintenance and fan replacement
  • Vegetation management expansion zone
  • Real-time soiling monitoring installation

Outcomes

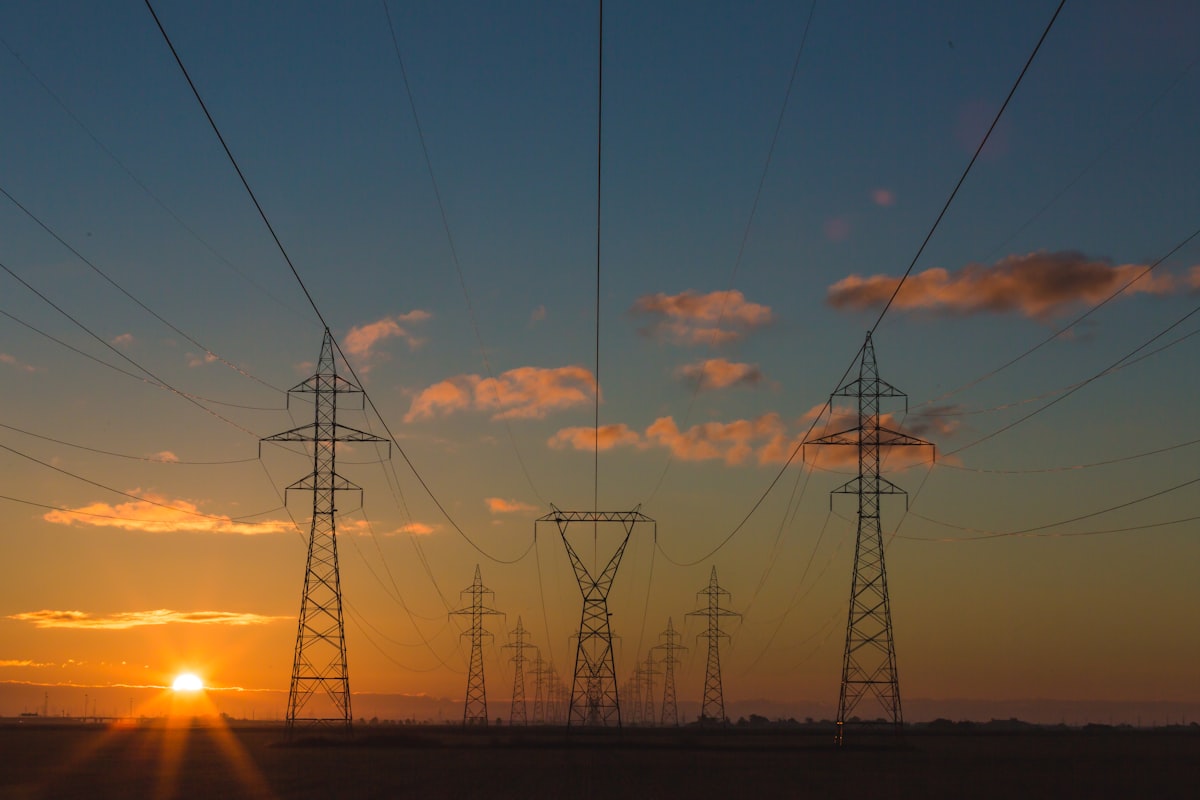
Following implementation of recommended corrective actions, system performance ratio recovered to 81.5% within four months. Annual energy production projections increased by approximately 520 MWh, representing significant revenue recovery over remaining facility lifetime.

Wind System Evaluation

Ontario Wind Farm Blade Erosion Impact Study

Location: Western Ontario System Type: 45 MW Wind Farm (15 Turbines) Assessment Period: Fall 2023
Wind turbine blade inspection

Challenge

Wind farm operator observed gradual decline in capacity factor from 38% (Year 1-2) to 34% (Year 5). Visual inspection suggested blade leading edge erosion, but quantitative impact assessment was needed to justify maintenance expenditure.

Assessment Approach

  • Detailed blade surface inspection via rope access technicians
  • Leading edge erosion mapping and severity classification
  • Power curve measurement for each turbine using nacelle anemometry
  • Computational fluid dynamics (CFD) analysis of eroded blade aerodynamics
  • Five-year wind resource and generation data correlation

Key Findings

  • All 45 blades exhibited leading edge erosion, ranging from moderate to severe
  • Erosion concentrated in outer 30% of blade span (highest velocity region)
  • Power curve deviation increasing with wind speed (maximum -12% at rated wind speed)
  • Estimated annual energy loss: 4,200 MWh across the farm

Environmental Behaviour Analysis

Site location near agricultural region and proximity to Great Lakes resulted in higher-than-typical airborne particle density. Combination of soil dust, sand, and ice particles created abrasive environment accelerating blade surface degradation. Erosion progression correlated strongly with seasonal precipitation patterns and freeze-thaw cycles.

Performance Insights

45
Blades Inspected
-8.7%
Average Power Loss
4,200
MWh Annual Loss
2.8 years
Repair ROI Payback

Recommendations Implemented

  • Leading edge protection system application to all blades
  • Surface repair and aerodynamic reconditioning
  • Regular inspection protocol (annual blade condition assessment)
  • Preventive coating application for remaining lifecycle

Outcomes

Post-repair power curve measurements demonstrated restoration of blade aerodynamic performance. Farm capacity factor recovered to 36.8% within six months. Economic analysis confirmed positive return on maintenance expenditure with payback period under three years.

Hybrid System Integration

British Columbia Solar-Wind-Battery Microgrid Optimization

Location: Coastal British Columbia System Type: 2.5 MW Solar + 3 MW Wind + 4 MWh Battery Assessment Period: Summer 2024
Hybrid renewable system

Challenge

Remote industrial facility implemented hybrid renewable microgrid to reduce diesel generator dependency, but system was not achieving expected energy self-sufficiency. Target was 75% renewable penetration; actual performance was 58%.

Assessment Approach

  • Comprehensive energy flow analysis (solar, wind, battery, diesel, load)
  • Control strategy evaluation and dispatch logic review
  • Battery cycling pattern analysis and degradation assessment
  • Renewable resource availability vs. load profile correlation
  • Grid code compliance and power quality measurement

Key Findings

  • Control system prioritizing diesel stability over renewable maximization
  • Battery depth-of-discharge limits too conservative, underutilizing storage
  • Solar curtailment during low-load periods despite battery capacity available
  • Wind turbine cut-in speed set higher than necessary
  • Load management capabilities not integrated with renewable forecasting

Environmental Behaviour Analysis

Coastal location provided excellent complementary solar-wind resource. Summer months featured strong solar irradiance with moderate wind; winter showed reduced solar but significantly increased wind speeds. Existing system was not fully exploiting this natural complementarity due to control limitations.

Performance Insights

58%
Initial Renewable %
73%
Optimized Renewable %
-32%
Diesel Fuel Reduction
+18 months
Battery Life Extension

Recommendations Implemented

  • Control logic reprogramming for renewable-first dispatch
  • Battery operating window expansion (20-90% SOC vs. previous 40-80%)
  • Wind turbine cut-in speed optimization
  • Load management integration with 24-hour renewable forecasting
  • Real-time optimization algorithm implementation

Outcomes

System modifications resulted in renewable penetration increasing to 73%, approaching original target. Annual diesel consumption reduced by approximately 220,000 liters. Battery cycling patterns optimized for longevity while improving energy storage utilization. Facility achieved significant operational cost reduction while maintaining power quality and reliability standards.

Achieve Similar Results for Your System

Professional assessment services deliver measurable performance improvements

Request Assessment